Software Engineering
2022 Class Profile
University of Waterloo
2022 Class Profile
University of Waterloo

Software Engineering (SE) at the University of Waterloo is an
interdisciplinary program supported by both the Faculty of Mathematics and the
Faculty of Engineering. Students spent 8 semesters in school with similar
schedules and also gained work experience over 6 co-ops. Undergraduates in the
Software Engineering program are awarded a Bachelor of Software Engineering
(BSE) degree (by request, the diploma may say Baccalaureate of Software
Engineering) at the end of their 4 ⅔-year journey.
SE is commonly compared to Computer Science, and is often seen as its
more-constrained, Engineering-oriented counterpart. Prospective students may
wonder whether SE is the right fit for them, and whether they’ll enjoy the
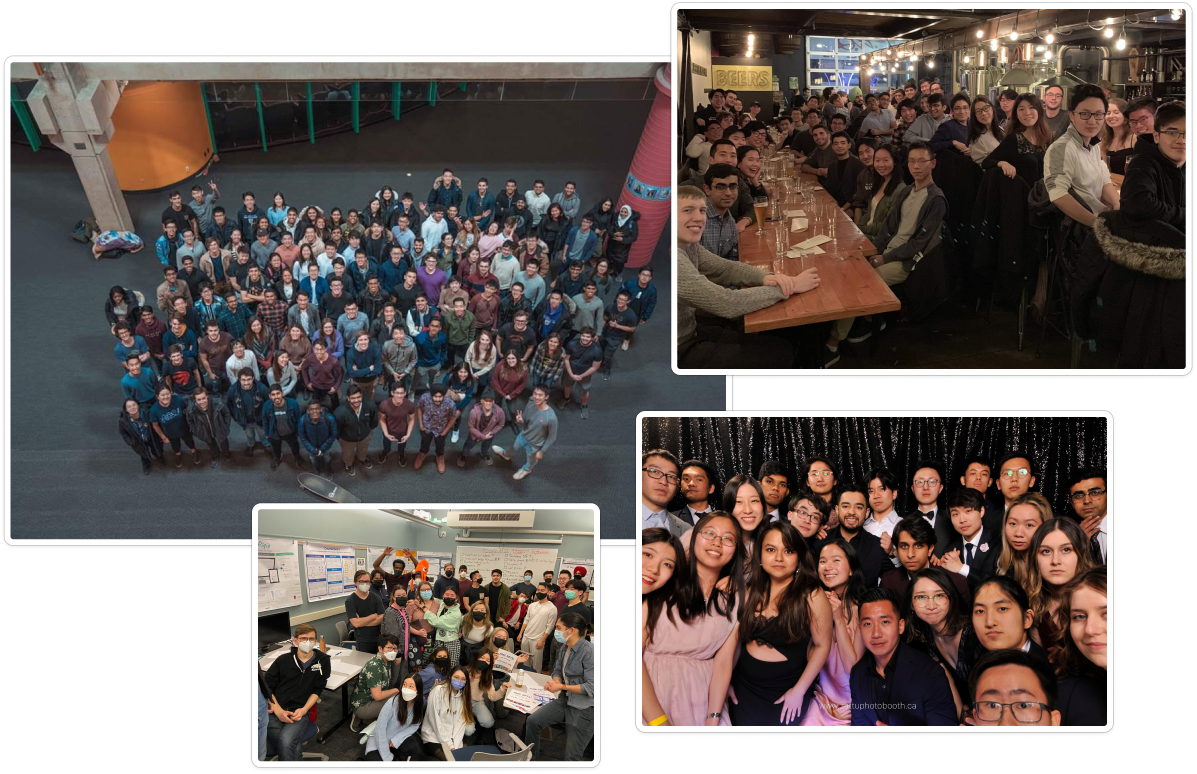
environment. This profile attempts to showcase who SE 2022 students are, what
they've done, and what their journey through university was like.
This profile is not affiliated with the SE program or the University of
Waterloo in any way.
For more photos of the class of 2022, check out the yearbook! https://sexxii.github.io/yearbook/
The findings in this report were derived from the results of a class survey.
In total, 63 out of 101 (62%) graduating SE students, and 3 who were in SE but
transferred out, responded.
SE classes can vary significantly depending on the year, so generalize from
this survey to other classes at your own risk.
Study terms are defined as 1A, 1B, 2A, up to 4B (8 terms). 4 month co-op terms
occur after every study term starting after 1B and ending before 4B.
Government shutdowns due to the Covid-19 virus began in February 2020, partway
through the 3A study term.
All analysis involving income is expressed in Canadian dollars (CAD). A
constant rate of 1 USD to 1.3 CAD was used to make comparisons consistent and
simple. As this rate varied over time, 1.3 was chosen due to its being an
approximate average USD to CAD exchange rate over the past 5 years.
The content of this class profile was inspired by the many profiles across
Waterloo Engineering that preceded it.
Gender, ethnicity, high school, family
Highschool exerience, programming languages, influences
Grades, attendance, courses, factors affecting grades
Companies, locations, salary, factors affecting salary
Sleep, partying, food
Exercise, physical health, mental health
Cases, vaccinations, impacts
Parents, friends, love life
Tuition, expenses, loans, investing, net worth
Decision-making, experience
Reddit usage, academic burnout, conflicts,
Students who transferred out of SE
Workload, staying or switching, happiness
Post-graduation plans, full-time compensation
Students come from many different ethnic backgrounds.
There is a significant number of respondents who identify as East Asian or
Caucasian.
There are many on-campus communities that support ethnic minorities on campus
such as
UW Black Association for Student Expression (UW BASE),
UW Indonesian Students Association, and
National Society of Black Engineers (NSBE).
85% of respondents were born in 1999.
23% of respondents identify as women. There are many on-campus communities that support the success of women in Computer Science and Engineering at UWaterloo. For example, Women in Software (WiSE), Women in Computer Science (WiCS), Women in Engineering (WiE), and Women Who Code Waterloo.
At least 5% of respondents are part of the LGBTQ+ community. There are many on-campus communities that support LGBTQ+ community such as Engiqueers, and Glow. This is not to say that only non-heterosexual people are part of the LGBTQ+ community.
74% of respondents grew up in Ontario, of which 60% grew up in the GTA/Toronto area specifically. In Canada, respondents also grew up in other provinces such as Alberta, British Columbia, New Brunswick and Quebec. Around the globe, respondents primarily grew up in India and China.
48% of respondents' first language is not English. There was a significant number of respondents who spoke English and Mandarin as their first language, but overall, there is a wide variety of languages spoken by students.
63% of respondents speak at least two languages. The most common languages spoken, other than English, are French and Mandarin. Among respondents who spoke 3+ languages, French was a common spoken language.
There are more parents with Master's and Doctorate degrees than those with Bachelor degrees. Compared to our parents, only a handful of respondents are planning on attending grad school. This could be a generational shift, or could be because entering the software industry does not require a Master's or Doctorate.
66% of respondents come from families whose income before they started at Waterloo is higher than the median Canadian family income in 2017 ($92,990). These numbers represent the income the students' family had prior to starting University. The majority of respondents have a family income between $100,000 and $200,000.
The majority of respondents have at least 1 sibling. With 44% of respondents being the eldest child.
The high school average for the class was 95.6% and the median was 96%. The 1st decile was 93%. Although it is recommended to have a high 90s average to get accepted into the program, 20% of respondents had an average less than 95%.
42% of respondents did not take part in any enriched program. The most popular Enriched Programs among respondents were AP and IB.
Calculus AB, Chemistry and Physics 1: Algebra Based were the most popular AP courses that respondents took.
Chemistry, Language A: Literature and Mathematics were the most popular HL courses.
Respondents took a wide variety of SL courses.
Of the respondents who attended CEGEP, 75% of them graduated it.
The students who attended CEGEP took part in science, mathematics, and computer science programs. To convert CEGEP course credits into university credits, you can find more information here.
The majority of respondents learned how to code before starting university. Fear not, the first year of the program provides helpful introductory programming courses CS 137 and CS 138.
61% did not have any close family who worked in tech.
Java and Python were the most popular first programming languages. Followed by Visual Basic and Turing.
Java, Python, and C++
JavaScript, Python, and C++ You'll notice a trend coming up - respondents are most comfortable with Python, C++ and Javascript and those three are also used most often on co-ops & interviews!
3A to 4A averages were higher than 1A to 2B averages. Classes moved online from 3A onwards, altering the format of assessments. This along with more freedom of choice for courses seems to have led to higher class averages.
Attendance consistently dropped term by term, with a huge drop between 2B and 3A. 3B and 4A have the most divided attendence numbers. On one hand, some respondents might have enjoyed their 4A & 4B classes more as they get to select almost all of their classes. On the other hand, some respondents may have preferred attending courses asynchronously.
56% of respondents failed at least one midterm. Failing a midterm does not necessarily mean that the course was also failed.
18% of respondents failed at least one class.
Respondents failed classes from a variety of departments.
72% of respondents went to at least 1 office hour.
Respondents enjoyed CS 343, CS 449 and CS 241 along with other courses from variety of departments.
Interactive: Click on a term to view the favourite classes for that term.
Least enjoyed courses are scattered across the board. 8 people agreed that SE 463 was their least favourite course.
Interactive: Click on a term to view the least favourite classes for that term.
Respondents had many incredible professors during their undergrad.
8 respondents responded to doing an a minor or option during their undergrad degree.
New Product and Advanced Technology were the two most popular categories for FYDP projects.
67% of respondents enjoyed their FYDP project.
38% of respondents may continue their FYDP.
Respondents spent more time working on FYDP during 3B than in 4A.
Students have the opportunity to take extra courses during each term. This is called overloading. In most terms, respondents didn't overload. However, in 2B more respondents chose to overload than not to.
Respondents overloaded for a variety of reasons including having a lighter future term, taking more electives and taking classes offered only in specific terms.
Most students did not CR/NCR any courses. Due to a covid-impacted term, respondents were able to CR/NCR any courses meaning that a mark would not show up on their transcript regardless of them getting a credit or not.
Replacing low marks and going on exchange were the main reasons to CR/NCR. Most respondents chose to do this to replace low marks from showing up on their transcript or impacting their average. It is also a side effect from taking courses on exchange (which must be CR/NCR).
Respondents mostly lived on campus in their 1A and 1B terms and then started to fan out around Waterloo in subsequent terms. Online classes also allowed students to travel across the country and across the world while studying.
Rent costs followed a downward trend across terms Between 1A and 1B, cost of residence ranged between $2000 to $5000 for the term. Presumably this is due to the cost of living on campus. From 2A to 4A, housing costs stayed around $2000 to $4000. However, for the first fully remote term after covid, there were many more respondents who lived rent free most likely with their families.
Interactive: Click on a term to view how much it cost for housing for that term.
Respondents generally lived with up to 5 people total.
Interactive: Click on a term to view how many people lived with each term.
Respondents typically did 1+ hackathons/term from their 1A to 2A terms, afterwards most did not attend any more hackathons.
Respondents spent more time working on side projects in their lower years.
Respondents participated in more SE events during their lower years.
Respondents participated in more technical extracurriculars earlier on in their university career.
Respondents participated in more technical extracurriculars (e.g. design teams) during their lower years.
Respondents also enjoyed participating in a variety of other clubs.
Respondents participated in more non-technical extracurriculars during their upper years. However during 2B, participation in these extracurriculars was fairly low.
Burnout seemed to be higher every other term (e.g. 1b, 2b, 3b).
At least 166 companies have hired an SE student.
Students had the opportunity to work in many different types of environments,
including lean startups, writing code in Japan, researching with professors,
and working at large tech companies. While a majority of students were
software engineers during their co-ops, some explored other areas such as game
development, product management, and trading.
The benefit of having 6 co-op terms is that students get to explore different
company sizes doing different positions in different cities. This is
invaluable for students because it helps students figure out what they want
upon graduation.
Co-ops happened all across North America, and a few across the world!
The majority that co-oped in the US worked in California or on the east coast.
Even though the University of Waterloo did not authorize any co-ops outside of
Canada once the pandemic hit, many respondents said they worked in the US for
their last few co-ops. This might have been possible due to the University
lowering the number of required (authorized) co-ops.
Interactive: Click on a location to hide or display the plot for that location.
30% of respondents picked California as their favourite work location, and 41% of respondents' favourite work location was in the US. Toronto was a close favourite with 24% of respondents picking it as their top choice. The pandemic likely hindered students from exploring opportunities outside of Canada as the percent of US locations dropped from 68% in 2021 to 41% in 2022. On the flip side, it is also surprising that California has dropped from 39.6% in 2021 to 30% in 2022, which suggests it may not be the right place for everyone, especially with the infamous cali or bust mentality.
Median hourly compensation increased over time. By the last co-op term,
compensation had on average increased by 2.8x compared to the first co-op
term.
Average hourly compensation per co-op term was
$19.86, $30.14, $38.18, $42.21, $46.37, $51.55 (in CAD).
The difference could be explained by the exchange rate between the USD and the
CAD, as more respondents started working in the US, and an increase in
salaries and stipends to compensate for the difference in living costs between
different locations. As a very loose example, renting in San Francisco
typically costs between $2,000 to $2,500 per month. In comparison, Waterloo
housing costs approximately $800 per month.
Note that these values do not include additional compensation such as housing
stipends.
As respondents gained work experience, they applied to fewer jobs over time, found more jobs outside of WaterlooWorks and returned to previous employers more frequently. Respondents applied to 3 times fewer jobs by their last co-op.
Most respondents had an "Excellent" or "Outstanding" co-op rating. Across every co-op term, at least 44% of respondents received an outstanding co-op rating and 91% received an excellent co-op rating or higher. During the 4th and 5th co-op terms, 60% and 59% of respondents received an outstanding.
Respondents worked in a variety of roles, the most popular being fullstack and backend roles. It is important to note that this is not the exact job title from each co-op. Rather, it reflects the various roles that respondents took. Respondents were able to select any number of roles per co-op.
Over the co-op interview cycles, respondents sometimes missed an interview or were late to interviews. Additionally, many respondents have bombed (did extremely poorly on) at least one of their interviews.
In order to rank jobs appropriately, salary is used as a proxy metric to measure job opportunities. Due to the limited expressiveness of this metric, the following results should be taken with a grain of salt because higher salary does not imply higher job satisfaction.
There is no clear correlation between grades and salary.
In other words, having a high cumulative average does not imply that the
student will get a good salary in the upcoming co-op term. This suggests that
there are more important factors than grades when it comes to finding a good
job.
Some companies do use grades as a cutoff to filter large candidate pools.
However, many companies are aware that grades are not a good indication of how
performant a student can be during co-op.
On average, women are paid less during co-ops.
The most significant gap occured during the 4th and 5th co-ops. Although the
data trends indicate that women are paid less than men, it is difficult to
determine which portion of the compensation difference is due solely to gender
bias, as opposed to other causes.
Note: There were about 39 men and 14 women who responded to co-op salaries.
A minor in culinary studies. SE students cooked often, with ~59% cooking over 60% of their meals themselves. That being said, this does not mean that respondents are master chefs.
Students clearly value sleeping at reasonable times.
The most popular answer was 1 AM, at which point ~67% of SE students
have gone to sleep. ~90% of SE students go to bed by 2AM.
However, some students still prefer sleeping late,
possibly due to work or personal reasons.
S.R.E.A.M - Sleep Rules Everything Around Me. Future students will be glad to see that studying SE does not mean sacrificing sleep. In fact, a strong majority of respondents stated sleeping more than 6 hours each night. Furthermore, ~13% of respondents reported sleeping more than 8 hours each night.
Only ~30% of students reported never pulling an all-nighter. While SE students are getting a good amount of sleep each night, 70% of students pulled atleast one each term. 3 students reported pulling 20 all-nighters each term.
Making time for fun before COVID. At least 52% of respondents went out/partied once a month, with ~7% doing so multiple times a week. Only 10% said they never partied. This somewhat goes against the stereotype of SE students being antisocial.
Making (less) time for fun during COVID. COVID brought in a variety of public health measures including restrictions on how many people can be inside your home, and the closing of public spaces. About 40% of respondents reported never partying during COVID.
The majority of respondents did not visit the hospital or ER, during their undergrad. However, some respondents went to a hospital or ER two or more times during their undergrad.
Respondents did not require a deadline extension due to injury or illness. The University's Illness or Extenuating Circumstances Policy was not well used by respondents. Only ~17.5% of respondents reported requesting a deadline extension due to illness or injury.
Going to class while sick during in-person terms was commonplace. Only 29% of respondents reported never going to class while sick during in-person terms. It is unknown whether this was because they never got sick during in-person terms or if they consistently went to class while sick.
Mental health is a vital part of our well-being that needs continuous
monitoring.
Over half of the respondents reported struggling with mental health problems
during their undergrad.
Starting post-secondary education can bring a lot of change and excitement to
a student's life. With that change, there are many factors that can also cause
students to struggle with their mental health. It's important to look out for
yourself and one another as everyone is fighting a different battle and may
need support at any moment.
The most common mental health issues were depression and anxiety. The cohort experienced a wide variety of mental health issues. Trying to manage academics, co-op, and social lives can take a toll on us. It's important to take some time to focus on ourselves and do the things that are important and relaxing for each of us.
Over half of respondents reported that mental health effected at least one school term. Mental health can have large impacts on a student's life ranging from academic to social. Approximately, 10% of respondents reported mental health affecting half of their undergrad degree.
University of Waterloo Counselling Services was the most popular mental health resource. While some respondents reported using some type of counselling service, many of those who struggled with mental health did not use any.
Over 75% of respondents felt imposter syndrome over their university years. Impostor syndrome refers to an individual's internal experience of believing that they are not as competent as others perceive them to be. The Software Engineering program is very competitive and has one of the highest admission averages in Waterloo. This can place students in a pressure-to-achieve environment which might have led to students feeling like an imposter.
By the end of their university career, around 57% of respondents do not feel imposter syndrome, while 24% of respondents still do. This shows a growth in the respondents' confidence over the years as they overcame their academic hurdles, experienced the real world during co-ops, and found their calling in Software Engineering.
Over 70% of respondents reported a higher self-esteem exiting the program. Self-esteem refers to an individuals overall opinion of themselves. The majority of respondents exited the Software Engineering program with a higher opinion of themselves than when they entered which shows incredible growth.
Active bodies and active minds. It's important to keep our bodies active as it can boost our overall health. In certain cases, aerobic exercise has been shown to reduce anxiety and depression.
Strengthening our lungs and muscles.
Respondents were involved in a wide variety of activities from running and
weightlifting to rock climbing and muay thai.
It's important to find the form of exercise that brings the most enjoyment to
each individual.
44% of respondents participated in intramurals. A lot of respondents tried intramurals at least once. Some were heavily involved in intramurals with 10% participating in intramurals during half of their academic terms.
Respondents participated in most intramural types offered by the university. Intramurals are a great way to get active in some organized sports and even learn a sport you haven't played before. It's also been a great way to meet people and have fun with friends while breaking a sweat.
Approximately 70% of respondents participated in a sport during their undergrad. Most respondents participated in a sport recreationally or competitively during their undergrad. 64% participated recreationally, and 5% trained in a sport competitively.
Covid-19 unexpectedly hit the class at the beginning of 2020 and classes moved online halfway through the 3A term.
Covid hit a sizable chunk of respondents with 20% of the respondants who personally got covid and 95% who knew someone who did.
Fortunately, all respondants were vaccinated with at least 2 doses, with 73% having gotten boosters.
Respondants also took covid tests when needed. 6 respondants took more than 20 covid tests, ranging from 40-58 tests each. Home testing kits were made readily available at local pharmacies and grocery stores around the same time that this survey was released.
A majority (71%) of respondants strayed towards "most of the time" when it came to following public guidance on social distancing and other covid rules.
Respondents did end up going to gatherings during the pandemic. There were 5 respondants who participated in gatherings exceeding 120 people, ranging from 200 to 400000 people.
19% of respondent's fulltime jobs and prospects were impacted by covid.
Of the respondents who were impacted, the largest impact was jobs moving from in-person to remote. Respondants were able to choose multiple responses.
Most respondents spoke with their parents or guardians at least once a week in first year (55%) and in fourth year (60%). Most people were in regular contact with their parents/guardians. It appears as though respondents spoke with their parents more frequently in fourth year than in first year.
Most respondents went home at least once a term in both first year and
fourth year.
Before the pandemic, most of us lived near campus and away from family.
From first year to fourth year we saw an increase in the number of people who
lived at home. Perhaps that was due to online classes or difficulties finding
housing.
On average, a softie has 4.08 friends from high school, 1.36 from co-op, 1.48 from residence, and 1.49 from orientation. Furthermore, a softie has, on average, 5.17 friends in SE.
Sofites tend to make many friends within the program. 53% of respondents reported that at least 40% of their friend group was made up of fellow SE students.
The SE cohort is a tight knit group. ~56% of respondents said they had met or spoken with over 60% of the class. However, we should acknowledge that those who were more likely to fill out the class profile may have also been more likely to have met others in the program.
About 29.6 % spent at least half of their degree in a romantic relationship. Out of 54 respondents, 20.3 % of them spent their entire degree single. Three people were in a relationship throughout their entire degree.
SEs explored their romantic options during their degrees. SEs most commonly had 3 relationships throughout university. However, respondents went on an average of 2.86 first dates.
Did SEcest -- a term coined by a previous class profile -- happen in our year? 1 out of 3 respondents said yes.
SE and sexuality Respondents had on average 2.3 sexual partners during their degree. 28% of respondents said they had no sexual partners during university. Two people said they had 12 sexual partners during their studies, and one person admitted to having sex on campus!
A numerical method of comparing life experiences? Before university, SEs had an average rice purity test score of 85.1. One person reported having a score of 35 (omitted from the graph to know skew results). The average score dropped to 54.5 after university.
Spilling the infideli-tea. 11.1 % of the 54 who answered were involved with cheating. A breakdown of how they were involved can be seen below.
The use of dating apps was evenly split between respondents. Most respondents did not use dating apps. However, it was very close, with 51% of respondents not using dating apps.
67% of respondents reported using some form of controlled substance recretionally Alcohol and weed were the most common.
26.4% of respondents admitted to going to class drunk or high A smaller percentage, 9.4%, said they took an exam drunk or high.
$69000
$69000 is how much it cost a Canadian student attending Software Engineering at Waterloo for 8 terms from 2017-2022. This includes tuition, co-op fee and about $625/term of misc fees (insurance, LRT pass, club fees) - some which are optional. This does not include housing or school materials (e.g. supplies, textbooks). All numbers are in CAD.
The average undergraduate tuition for Canadian citizens studying in Canada is around $6,693/year compared to $17,000/year for SE.
Tuition breakdown
| Term | Undergrad Domestic Tuition | Co-op Fee | |
|---|---|---|---|
| Fall 2017 | 7329 | 709 | |
| Winter 2018 | 7392 | 709 | |
| Fall 2018 | 7761 | 729 | |
| Spring 2019 | 7761 | 729 | |
| Winter 2020 | 6985 | 729 | |
| Fall 2020 | 6985 | 734 | |
| Spring 2021 | 6985 | 739 | |
| Winter 2022 | 6985 | 739 |
88% of respondents payed for at least half of their tutuion using money earned from co-op. The next largest portion of income came from respondent's families. For Canadians, this is typically from a Registered Education Savings Plan (RESP).
85% of respondents spent less than $550 on school materials. 7 respondents spent more than $550 in school materials over their entire school career with the maximum being $2000.
45% of respondents did not take any student loans. Co-op provides the oppurtunity to have an income every 4 months. This may be a factor allowing students to avoid the need for loans.
85% of respondents invested their money. Index Funds and Equities were the most popular methods of investments, used in 60% of responses. Additionally respondents also invested in crypto. Respondents were able to select multiple options.
Of those who invested, most respondents either invested below 40% or above 70% of their wealth.
89% of respondents graduated debt-free. The co-op program can help students earn money to pay off debts and expenses as they work towards their degree.
69% of respondents were at least somewhat satisfied (4 or 5) with their current financial situation.
Had there been less exchange cancellations and better course flexibility, more softies would have gone on exchange. Of the 56 responses received for the exchange section, just 11% went on exchange.
SE students all went on exchange on their 3A term. All respondents went abroad for only a single term. Travel restrictions imposed by Covid prevented students from going later terms. The sister universities SEs attended were all in Singapore and Sweden.
We asked our exchangees to provide us some insight into their exchange experience.
Reflecting on our time at Waterloo means more than making some graphs. Here are a handful of stories from first year.
"On the first day of class, when the ECE 105 professor walked up to the board, no introduction or anything - and started scribbling physics problems on the whiteboard - before he gave us his name, Mansour 😂 and he became one of the most legendary profs in SE"
"I loved the moment when someone brought binoculars to ECE 105 and Mansour sat them at the front of the class. That prof was an absolute legend!"
"I think that the most memorable parts of my first year were the late night ECE105 study sessions with Prof Mansour. They were extremely helpful and always entertaining."
"Getting a co-op :)"
"MC 1085"
"cusec was a fun time"
"Staying up until 3 am working on the SE101 project with friends"
"Every time my friends would get drunk after a party, we would sneak into EIT so we could look at the dinosaurs."
"One of our classmates threw a party in an AirBNB and trashed the place, and someone punched through the window of the front door; in class he was reviewing the fines (esp. for strange things, like "moved plant").
Respondents enjoyed a variety of restaurants by the Waterloo campus and in Uptown/Kitchener.
Walmart was the top grocery store, narrowly beating out the competition.
With newfound freedom, many respondents lived away from Waterloo and from home during their online terms.
Dogs and cats were top condenders!
We asked for respondents' favourite colors in the form of a hex code!
Not all interviews go smoothly, below are a few stories.
"Thought interview was the next day at the same time so overslept, never picked an 8:30am time slot after that"
"Interviewer vaped the whole time"
"An interviewer looked at my transcript for a few minutes and then asked why I did so bad in Linear Algebra.
"I got food poisoning the day before my onsite and spent the whole night throwing up. I forced down a few coconut waters and matcha teas before putting on my best high-energy face. During my second interview, I leaned over to fart - and instead, I shat my pants. I excused myself from the interview, went to the bathroom to deal with it, and then did the next 3 interviews before going home and lying on my bed wide-eyed, unable to sleep because of all the caffeine."
"A co-op asked me to design an elevator, and I spent half an hour talking about the aesthetic designs of an elevator. E.g. have a nice rug and nice music"
"My boss said the only reason they hired me was because my cover letter was so arrogant and they had to see what I was like."
"Was super sick for uber interview, coughed so much the interviewer covered their face with their tshirt - and no, I didn't get the job"
Most of the class has never gotten into a physical conflict, though there were a few fights. Unlike the class of 2021, a few respondents said they had gotten into fights outside a sport setting.
We made it through Waterloo Engineering, but not without some hurdles along the way. School isn't always easy-going. On top of what you see in the graph, 3 respondents cried 10 or more times per school term.
Needless to say, we're big redditors. Here is a breakdown of how many hours were spent by respondents on the UW Reddit.
Almost all respondents spent some time on social media per week. One respondent spent over 50h/week on social media! That's longer than a fulltime job - very impressive!
A sizable portion of respondents didn't spend any time on video games. One respondent spent 40h/week on video games. That's also a fulltime job - impressive!
These were some of our respondent's favourite co-op experiences!
"Flying out to phoenix to visit a call center and spending a few days afterwards driving around alone in arizona and sleeping in the car."
"Working in Singapore, lived in a hostel for 4 months while doing the co-op. Made friends from all different nationalities and age groups (18-65)"
"FOOD. Chocolate covered nuts, cheese, cookies, granola bars, juice and LaCroix. And other office perks like lunchtime Nintendo Switch games, Ping Pong, PS4, Jackbox."
"Going to Yosemite for a full weekend of sick hikes and amazing friends."
"Sharing a building with another company and all the co-ops from both companies would hang out."
"Working at a startup in downtown Toronto and hanging out with the other co-ops after work every day!"
"Deciding to go to the London office of my company when returning as an intern was a great idea since I got to live in an entirely new continent to me."
Respondents liked Vancouver the most with 4 votes. Next up was Iceland with 3 and Singapore with 2.
Respondents are most looking forward to visiting Japan! The culture, scenic views and food are just the beginning for why people want to visit Japan.
Here are a handful of stories from our final years at Waterloo.
"I loved 4B when everything moved back to in person and I got to hang out with people in our cohort gain."
"A bunch of my friends/classmates came as moral support when I got my ears pierced this term :))"
"When Peter Buhr started using crazy analogies in CS 343 - insanely underrated storyteller"
"Pranks night :)! Finally seeing so many of our classmates after 2 years, putting our jokes and signs all over DC, and remembering how fun and creative everyone is! Running around DC and the Engineering buildings, and seeing our banner next to all of the other engineering programs."
All respondents who transferred out of SE went into the Computer Science program. However, only 3 transfers responded to the class profile survey.
A flexible course schedule and avoiding a specific course were the main reasons for switching out of Software Engineering. The Engineering program has a relatively rigid course schedule which offers students the flexibility to choose courses usually only in their fourth year. The Computer Science program, on the other hand, is less restrictive and allows students to customize their schedules freely. Surprisingly, no respondents chose Exchange or Graduating Early as the most important reson for switch out.
All of the transferred students were happy with their decision to switch. The Computer Science program was successfully able to provide the transferred students with a better place to align themselves with their university goals.
35% of respondents considered CS 343 - Concurrency to have the highest workload. Next up was SE 350 - Operating Systems which 31% of the respondents chose. Fortunately, these two courses were not taught during the same term.
9% of respondents plan to work towards their professional engineer (P.Eng.) designation.
29% of respondents seriously considered switching out of SE at some point during their degree.
Most respondents who seriously considered switching out of SE indicated they would study Computer Science instead.
Most respondents did not consider dropping out of University.
91% of respondents would choose Waterloo SE again if they had to redo university.
Respondents were asked if they felt burnt out during the middle of their 4B term. 33% did feel burnt out.
67% of respondents had senioritis during 4B.
81% of respondents rated SE a top score of 5, and 96% of the class rated 4 or above. Shoutout to the SE faculty and the vibrant student community!
One month proior to graduating, 93% of respondents had already accepted a job offer.
32% of respondents chose career growth as their top motivation in deciding their fulltime plans.
The next most popular factor was compensation.
At the time of the survey, 71% of respondents were planning to start their careers in the US.
Meta is the most popular company for respondents to start their careers at. 43 respondents answered this question, which is less than half of the total graduating class. It is likely that the full breadth of companies and industries is larger and more diverse.
The majority of respondents plan to start their careers out at large/established companies.
The majority of respondents are content with their post grad plans.
Take this section with a huge grain of salt. The sample size for the following questions was only 50. Additionally, all currencies in this section have been converted to CAD. The exchange rate used for this question and the ones that follow was 1.25 CAD per 1 USD. The median base salary is $161,200 and mean is $168,887.
The median first year stock grant was $48,750, with the mean being $41,866. Less than 5 respondents had a first year stock grant of more than $100,000.
Respondents had a median one-time bonus of $65,000 and mean of $81,311.
End of year/recurring annual compensation ranges with a median of $16,000 and mean of $56,747.
Total stock grant had a mean of $167,914 and median of $195,000. This typically vests over 4 years. Less than 5 respondents had a total stock grant of over $400,000.
Median first year comp was $305,920 CAD and mean is $336,276 CAD. This number includes all forms of remuneration eg. signing bonuses and equity.
The co-op experience acts as a great pipeline for hiring young talent for companies. It also enables students to find a workplace they enjoy, as shown by the amount of students opting to return to a co-op employer rather than accepting an offer elsewhere.
Respondents who returned to a previous co-op typically interned during their 5th or 6th co-op.
A sizable proportion plan to work remote for at least part of their work week. This reflects a broader industry shift towards remote work.
Majority of respondents plan to stay at their first company for 1-4 years.
Majority of respondents are planning to stay away from their home country for at least 5 years.
We hope you enjoyed reading the University of Waterloo Software Engineering 2022 Class Profile!
This project wouldn't have been possible without the help of some great people:
Robbie Zhuang, Heather Musson, Wesley Leung, Bimesh De Silva, Tina Gao, Alex Girard, and Amanda Morin for volunteering their time to work on this profile over the past year.
Andy Zhang and the 2021 Class Profile Team for allowing us to fork the previous sites, saving us time and letting us focus on making this profile more personal than ever before.
Software Engineering Program Homepage https://uwaterloo.ca/software-engineering/
Co-op at UWaterloo https://uwaterloo.ca/co-operative-education/
Academic Calendar https://ugradcalendar.uwaterloo.ca/page/ENG-Software-Engineering
Software Engineering 2021 Class Profile https://sexxis.github.io/classprofile/
Software Engineering 2020 Class Profile https://uw-se-2020-class-profile.github.io/profile.pdf
Software Engineering 2018 Class Profile https://classprofile.andyzhang.net/
Electrical and Computer Engineering 2021 Class Profile https://ece2021profile.github.io/report.pdf
Mechatronics Engineering 2020 Class Profile https://tron2020classprofile.github.io/
Management Engineering 2020 Class Profile https://uwaterloo-mgte-2020-class-profile.github.io/mgteprofile.pdf
Biomedical Engineering 2019 Class Profile https://medium.com/uwaterloo-voice/university-of-waterloo-biomedical-engineering-2019-class-profile-5e54e8371ed1
Systems Design Engineering 2019 Class Profile https://ndey96.github.io/syde_2019_class_profile.pdf
2022 Class Profile Code https://github.com/sexxii/classprofile/
2021 Class Profile Code https://github.com/sexxis/classprofile/
2018 Class Profile Code https://github.com/andyzg/classprofile